Back to Journals » Breast Cancer: Targets and Therapy » Volume 16

Transcription Factor Forkhead Box Protein 3 (FOXP3) as a Prognostic Indicator for Postoperative Outcomes in Patients with Breast Cancer: Establishment of a Prognostic Nomogram
Authors Tan C ![]() , Xu J, Zhang S, Liu S, Yang X, Wu D, Yu B, Huang Y
, Xu J, Zhang S, Liu S, Yang X, Wu D, Yu B, Huang Y
Received 5 August 2024
Accepted for publication 14 October 2024
Published 21 October 2024 Volume 2024:16 Pages 705—723
DOI https://doi.org/10.2147/BCTT.S484055
Checked for plagiarism Yes
Review by Single anonymous peer review
Peer reviewer comments 2
Editor who approved publication: Professor Robert Clarke
Chunlei Tan,1 Jinling Xu,2 Shiyuan Zhang,1 Shuqiang Liu,1 Xiaotian Yang,1 Danping Wu,1 Boqian Yu,1 Yuanxi Huang1
1Department of Breast Surgery, Harbin Medical University Cancer Hospital, Harbin, Heilongjiang, 150081, People’s Republic of China; 2Endoscope Department, Harbin Medical University Cancer Hospital, Harbin, Heilongjiang, 150081, People’s Republic of China
Correspondence: Yuanxi Huang, Department of Breast Surgery, Harbin Medical University Cancer Hospital, Harbin, Heilongjiang, 150081, People’s Republic of China, Tel/Fax +86-0451-86298053, Email [email protected]
Purpose: The current investigation is to assess FOXP3 expression in breast cancer patients and evaluate the predictive significance of FOXP3.
Patients and Methods: A cohort of 313 cases between January 2015 and November 2015 were enrolled this research. Immunohistochemistry (IHC) assay was utilized to detect the expression levels of FOXP3 in primary breast carcinoma specimens. These patients were separated into two groups by semiquantitative scoring approach. Chi-square test and Fisher’s exact test were conducted to investigate the correlations between FOXP3 expression in tumors and clinicopathological variables. Kaplan–Meier method and Log rank test were utilized to generate survival curves for disease-free survival (DFS) and overall survival (OS). The independent factors were examined using Cox regression analysis. Nomogram models were created for assessing DFS and OS rates.
Results: Depending on the levels of FOXP3 expression in tumors, these patients were categorized into two groups: low FOXP3 expression (174 cases) and high FOXP3 expression (139 cases). The patients exhibiting low levels of FOXP3 expression in tumors demonstrated a longer survival duration contrasted with those with high expression (DFS: 88.75 vs 65.87 months, χ2=36.1100, P< 0.0001; OS: 89.70 vs 78.37 months, χ2=32.4900, P< 0.0001). Multivariate analysis revealed that FOXP3 was a significant prognostic factor [DFS: hazard ratio (HR): 2.822, 95% CI: 1.595– 4.992, P< 0.0001; OS: HR: 3.232, 95% CI: 1.812– 5.763, P< 0.0001]. The good predictive clinical utility of FOXP3-based nomograms within the threshold probability range for different survival rates was demonstrated by calibration curve and decision curve analyses.
Conclusion: FOXP3 expression serves as a crucial prognostic indicator in breast cancer patients, and may aid preoperative evaluation in clinical practice.
Keywords: breast cancer, FOXP3, chemotherapy, radiotherapy, survival
Introduction
Breast cancer tops the list of the most commonly diagnosed malignancies1 and also represents the primary cause of cancer-related deaths among female populations globally.2 Data from the National Cancer Center in China, breast cancer is expected to about 357,200 new cases, and 75,000 deaths due to breast cancer.3 Breast cancer represents a diverse range of neoplastic diseases, characterized by their considerable heterogeneity.4 The current prediction of breast cancer outcomes remains imperfect, necessitating the discovery of additional prognostic factors to enhance the precision of individualized treatment strategies. Many evidences prove that the capability of the immune system to detect and eliminate tumor cells through surveillance is dysfunctional in breast cancer patients.5–7
Tumor-infiltrating lymphocytes (TILs) are considered to reflect the immune system’s defense mechanism against malignant tumors.8,9 Tregs, also named regulatory T cells, are an exceptional subpopulation within the T cells that can inhibit the activation of immune cells, thereupon then sustaining systemic immune homeostasis.10,11 Furthermore, Tregs, a subset within the CD4+ T cells, are identified by their expression of the forkhead box transcription factor 3 as a distinct marker molecule.12 Forkhead box protein 3 (FOXP3) is categorized within the forkhead / winged-helix transcription regulator family, and is thought to the standard, distinctive identifier for Treg cells.13,14 The increase of FOXP3+ Tregs induced by the tumor cells suggest potential obstacles in the attempt of cancer immunotherapy.14 Some studies have proved that the elevated Treg infiltration within the tumor bed was related to adverse clinical outcome.15,16 The expression of FOXP3 in tumor cells not only increases the possibility of tumor infiltrating Tregs affecting anti-tumor immunity but also increases the possibility of tumor cells themselves regulating T cell function via FOXP3, providing a potential prognostic marker. In small cell lung cancer (SCLC), patients with higher ratios of FOXP3(+) cells in tumor infiltrates have a worse survival rate.17 However, no definitive conclusion has been drawn regarding the association between the expression of FOXP3 in tumor cells and the prognostic outcome of malignant tumors, particularly breast cancer.
Our research was undertaken to evaluate the predictive value of FOXP3 in breast cancer tissues, and demonstrated the correlation between FOXP3 expression levels in tumor cells and clinical features among patients with breast cancer. The Cox regression model was performed to discern the prognostic markers. Consequently, the current study indicated that FOXP3 was an underlying predictive biomarker for patients with breast cancer, low FOXP3 expression in tumor cells was related to better breast cancer prognosis, offering a novel biomarker for predicting patient survival.
Materials and Methods
Patients and Specimens
The 313 cases of breast cancer patients who received operations in our hospital from January 2015 to November 2015 were enrolled in the retrospective cohort study. The patients’ tissue samples preserved with formalin-fixed paraffin-embedded (FFPE) were obtained from the pathology department. This research received approval from the Ethics Committee of Harbin Medical University Cancer Hospital (Grant Number: KY2023-38). In this study, all participants were thoroughly informed about the objectives, procedures, potential risks, and their rights related to the research. Specifically, written informed consent was obtained from each participant, documenting their agreement to participate in the research and authorizing the use of their data for scientific analysis.
Inclusion and Exclusion Criteria
The following were the inclusion criteria: 1) diagnosed with breast cancer by histopathology; 2) all selected patients underwent surgical treatment; 3) entire follow-up documentation. The following were the exclusion criteria: 1) underwent antitumor therapy, including chemotherapy and radiotherapy; 2) characterized by metastasis or other forms of malignancy; 3) accompanied by autoimmune diseases.
IHC Staining Assay
The standard protocols were followed for the manual IHC staining assay: (1) The tissues of breast cancer patients underwent paraffin embedding. (2) The paraffin slicing procedure followed by dewaxing process involves soaking the slices in xylene for three rounds of 15 minutes each, then two rounds of 5 minutes in anhydrous ethanol, followed by 5 minutes in 85% and 75% alcohol, respectively. Finally, the slices are rinsed with distilled water. (3) Antigen retrieval: the tissue slices were submerged in a restoration chamber filled with EDTA-based antigen retrieval solution (pH 9.0) and underwent antigen retrieval by microwave irradiation. Then, the medium heat was maintained for 8 minutes until boiling, then the heat was turned off for 8 minutes, and subsequently reduced to medium low heat for 10 minutes. (4) Blocking endogenous peroxidase: the slice was immersed in a 3% hydrogen peroxide solution and incubated in the dark at room temperature for 25 minutes. (5) Blocking of nonspecific binding: after incubation in a 3% solution of bovine serum albumin (BSA), the tissue was sealed for 30 minutes at room temperature. (6) Primary antibody added: The FOXP3 antibody (Ab20034, Abcam, Shanghai, China), diluted to a ratio of 1:500, was incubated overnight at 4°C in a humidified chamber. (7) Secondary antibody added: the goat anti-mouse IgG H&L (GB23301, Servicebio, Wuhan, China) diluted to a ratio of 1:200, was incubated for 1 hour at room temperature in a humidified chamber. (8) DAB color rendering. (9) Nuclear staining with recombinant reagents. (10) Dehydration followed by sealing. (11) Observation under a microscope by the Aperio Image Scope system.
Assessment Techniques for Pathological Clinical Indices
Cancer staging was performed in accordance with the staging systems established by the American Joint Committee on Cancer (AJCC) and the Union for International Cancer Control (UICC). IHC was used to determine the expression of FOXP3, which was subsequently assessed according to the intensity of the cells and staining density, and was blinded to the clinicopathological data. The density of positively stained cells of FOXP3‑positivity (FOXP3+) was as below: (1) 0-score: <1% stained; (2) 1-score: 1% to 10% stained; (3) 2-score: 11% to 50% stained; (4) 3-score: 51% to 75% stained; (5) 4-score: 76% to 100% stained. The staining intensity of FOXP3‑positivity (FOXP3+) could be categorized as below: (1) 0-score: no staining observed. (2) 1-score: Slight yellow tint visible. (3) 2-score: Moderate brownish yellow coloration. (4) 3-score: Prominent yellowish-brown staining. According to the intensity and staining density of the cells: 1) Negative = 0 point; 2) Weak positive = 1–3 point; 3) Moderately positive = 4–8 points; 4) Strong positive = 9–12 points, respectively. In this study, patients were separated into two separate groups based on FOXP3 expression: low expression (scores < 4 based on stained cell density and intensity) and high expression (scores ≥ 4).
Followed-Up
In our investigation, post-surgical follow-up data were obtained from inpatient visits, outpatient appointments, or phone calls. The DFS referred to the duration between the date following curative resection and the occurrence of either local or distant metastasis. The OS was conceptualized as the duration that begins on the date following curative resection and ends either with the death of the patient for any reason or at the date of the last follow-up, depending on the context.
Data Analysis Statistics
All data analysis statistics were performed utilizing the SPSS Statistics software version 22.0, provided by IBM Corp., as well as the R statistical computing language, version 4.2.2, originating from Vienna, Austria. The URL for R is: http://www.R-project.org/. An investigation was conducted to assess the relationships between FOXP3 expression levels and various clinicopathological factors among breast cancer patients, employing both the Fisher’s exact tests and Chi-square test. The Kaplan–Meier method was utilized for computing the survival curves of both DFS and OS, followed by a comparison using the Log rank test. The potential independent factors were determined through a Cox regression analysis. Nomogram models were additionally developed to assess the DFS and OS rates. The clinical utility of the prediction models was analyzed by using calibration curve and decision curve analysis.
Results
Detection of FOXP3 in Breast Cancer Tissues
The IHC staining was utilized to assess the expression of FOXP3 in breast cancer tissues. Based on electron microscopy and semi-quantitative scoring, 174 breast cancer patient samples exhibited low FOXP3 expression (negative or weakly positive), while 139 samples demonstrated high FOXP3 expression (median-positive or strongly positive). Representative images for the expression of FOXP3 are presented in Figure S1. In breast cancer patients, those with low FOXP3 expression exhibited significantly longer survival times than those with high expression, both in DFS (DFS: 88.75 vs 65.87 months) and OS (OS: 89.70 vs 78.37 months). The difference was statistically significant (DFS: χ2=36.1100, P<0.0001; OS: χ2=32.4900, P<0.0001) (Figure 1A and B).
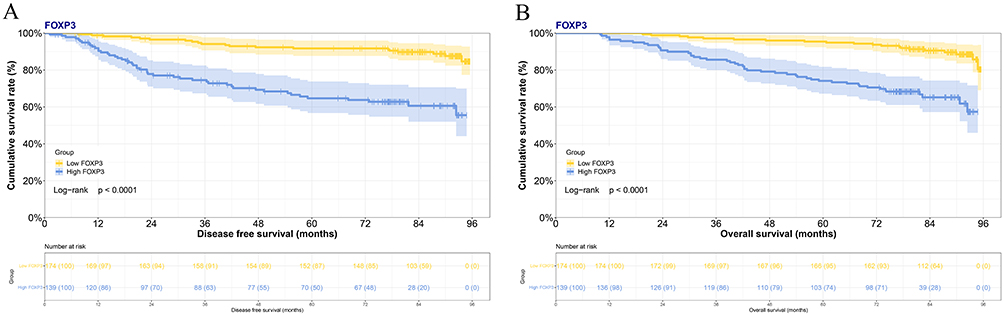 |
Figure 1 Breast cancer survival curve correlating FOXP3 expression with disease-free survival (DFS) (A) and overall survival (OS) (B). |
Demographic Features
Of these enrolled patients, 71 (22.7%) cases with a family history, 69 (22.0%) cases with basic disease, including 40 cases with hypertension, 16 cases with diabetes mellitus, and 13 cases with coronary heart disease. According to the FOXP3 expression levels, the patients were segregated into two separate groups: one group exhibiting low FOXP3 expression (174 cases) and another demonstrating high FOXP3 expression (139 cases). In comparison to these patients, the level of FOXP3 expression was significantly related to histologic grade (P=0.025), molecular subtype (P=0.004), ER (P<0.001), endocrine therapy (P=0.001). The detailed information was presented in Table 1.
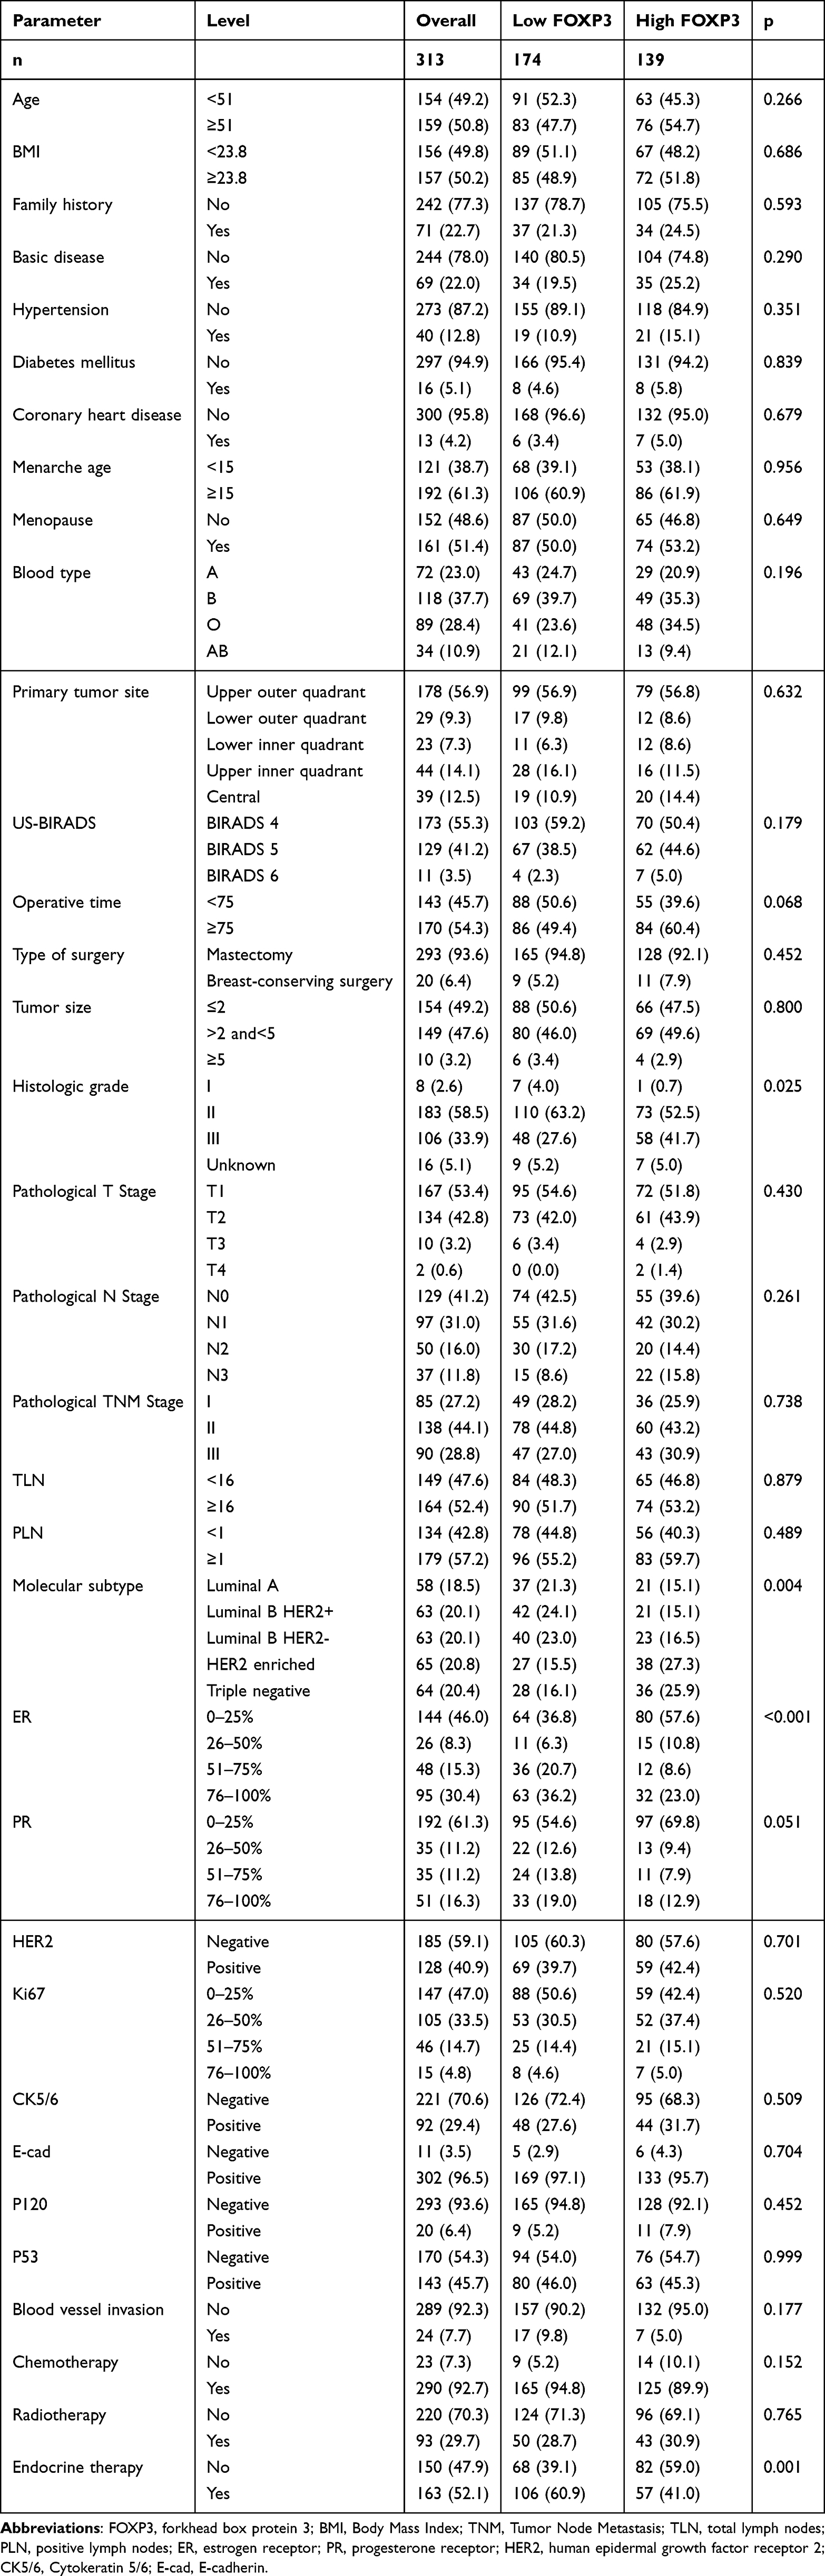 |
Table 1 Demographic and Clinicopathologic Characteristics of Patients with Breast Cancer |
Linkages Between the FOXP3 Expression Levels and Metastatic Information in Breast Cancer
The detailed metastasis data were presented in Table 2. The levels of FOXP3 expression were correlated with lung metastasis (P=0.006), liver metastasis (P=0.003), bone metastasis (P=0.001), clavicle metastasis (P=0.006).
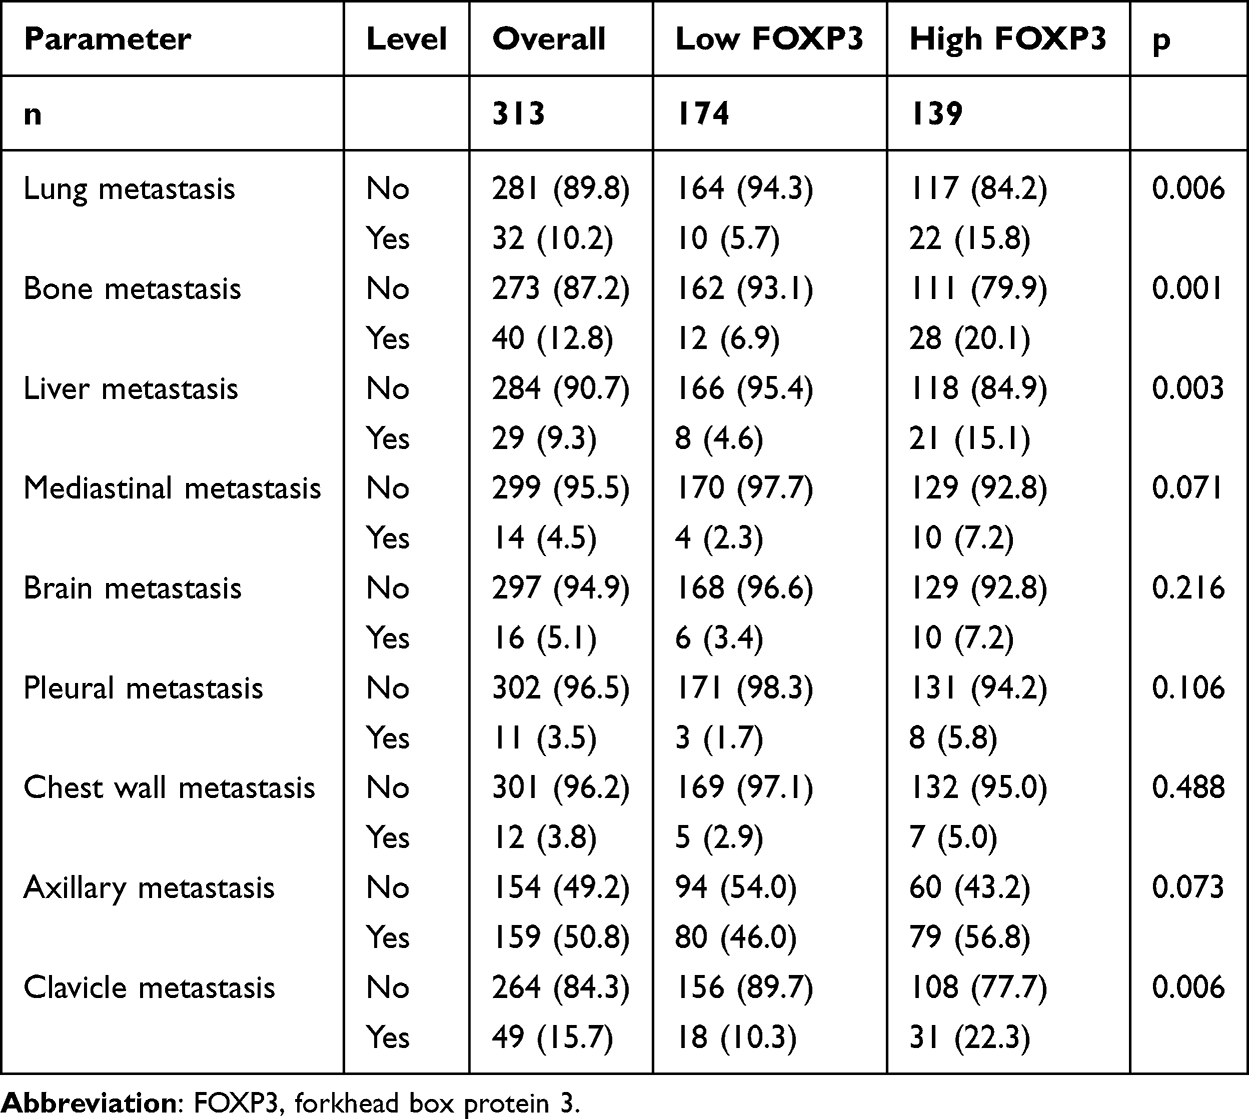 |
Table 2 Associations Between FOXP3 Expression and Metastasis in Breast Cancer |
Association Between FOXP3 Expression and Standard Hematological Indices
In the present investigation, utilizing the median values of parameters, the standard hematological indices were divided into two groups. By comparing the two groups based on FOXP3 expression, notable relationships were observed for lactate dehydrogenase (LDH) (P=0.046), blood urea nitrogen (BUN) (P=0.030), prealbumin (PAB) (P=0.014), carcinoembryonic antigen (CEA) (P=0.026), international normalized ratio (INR) (P=0.045), prothrombin time (PT) (P=0.035). The detailed information was presented in Table 3.
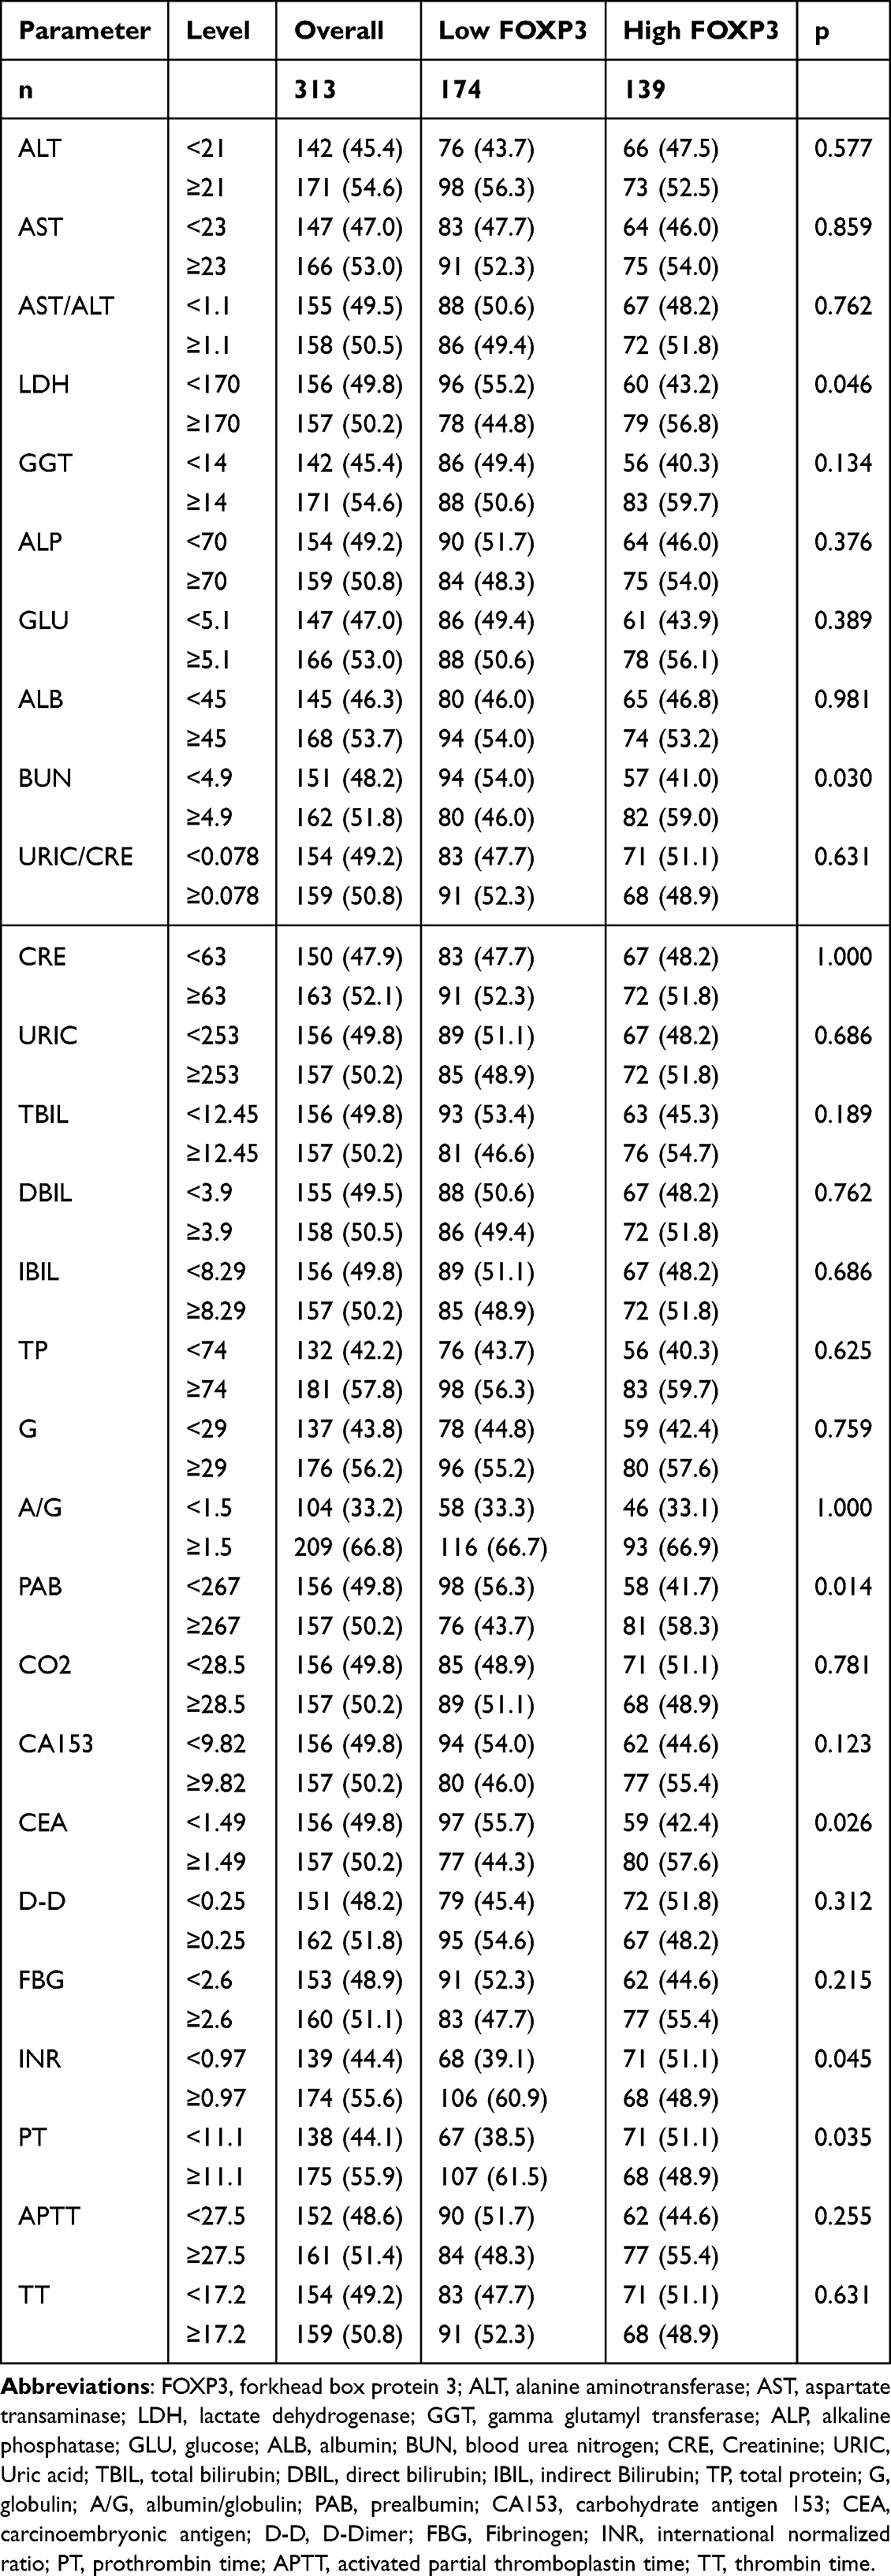 |
Table 3 Relationship Between FOXP3 Expression and Common Hematological Parameters |
Analysis of Adjuvant Therapy Subgroups Based on FOXP3 Expression Within the Group of Breast Cancer Patients Following Surgery
The 290 cases among these patients were given chemotherapy. According to the FOXP3 expression, the patients were segregated into two distinct groups: a low (165 cases) and a high (125 cases) FOXP3 expression group. Low FOXP3 expression patients had significantly longer DFS (88.97 months vs 65.87 months) and OS (89.83 months vs 78.60 months) compared to high expression patients, the difference was statistically significant (DFS & OS: P<0.0001) (Figure S2).
The 163 cases underwent endocrine therapy among these patients. Patients were grouped into low (106 cases) and high (57 cases) FOXP3 expression based on their expression levels. Patients with low FOXP3 expression had a prolonged survival duration than those with high expression (DFS: 89.00 vs 78.80 months; OS: 89.83 vs 81.67 months), but the observed difference lacked statistical significance (DFS: P=0.16; OS: P=0.17) (Figure S3).
The 93 cases of these patients underwent radiotherapy. Patients were grouped into low (50 cases) and high (43 cases) FOXP3 expression based on their expression levels. Patients exhibiting low FOXP3 expression demonstrated a significantly a prolonged survival duration compared to those with high FOXP3 expression, as reflected in their DFS and OS (DFS: 83.94 vs 39.20 months; OS: 85.94 vs 78.67 months), statistical analysis confirmed the significance of the difference observed between the two groups. (DFS: P=0.0036; OS: P=0.0066) (Figure S4).
Post-Surgical Subgroup Evaluation of FOXP3 Expression in Relation to TNM Staging in Breast Cancer
The patients in this study were classified as follows: 85 cases classified as stage I, 138 cases as stage II, and 90 cases as stage III. The patients in Stage I were categorized into two distinct groups by FOXP3 expression levels: a low expression group (49 cases) and a high expression group (36 cases). Patients demonstrating low levels of FOXP3 expression showed significantly longer survival times compared to those with high expression (DFS: 82.42 vs 77.95 months; OS: 87.30 vs 79.29 months). The two groups exhibited a statistically meaningful difference in terms of survival time. (DFS: P=0.035; OS: P=0.035) (Figure S5).
The patients in Stage II were segmented into two different groups based on FOXP3 expression: one with low expression (50 cases) and the other with high expression (88 cases). The patients displaying low levels of FOXP3 expression exhibited longer survival durations compared to those expressing high levels (DFS: 89.90 months vs 76.82 months; OS: 89.97 months vs 79.87 months), the statistical significance of difference separating the two groups was verified (DFS: P=0.043; OS: P=0.068) (Figure S6).
The patients in stage III were classified into two distinct groups: 47 cases with low FOXP3 expression and 43 cases with high FOXP3 expression, based on their FOXP3 levels. Patients with lower FOXP3 expression survived longer than those with higher expression (DFS: 72.63 vs 32.99 months; OS: 82.77 vs 53.07 months), and the survival disparity exhibited statistical significance (DFS & OS: P<0.0001) (Figure S7).
The Univariate and Multivariate Approaches Were Applied to Analyze Potential Prognostic Elements Through the Cox Proportional Hazards Model
Multivariate assessment utilizing the DFS proportional hazard modeling revealed that FOXP3 [95% CI: 1.595–4.992, HR: 2.822, P<0.0001], lung metastasis (95% CI: 1.266–6.291, HR: 2.822, P=0.011), brain metastasis (95% CI: 3.407–16.280, HR: 7.447, P<0.0001), bone metastasis (95% CI: 1.611–7.338, HR: 3.438, P=0.001), pathological TNM Stage (95% CI: 3.009–12.639, HR: 6.167, P<0.0001), radiotherapy (95% CI: 0.148–0.621, HR: 0.303, P=0.001), endocrine therapy (95% CI: 0.109–0.378, HR: 0.203, P<0.0001), chemotherapy (95% CI: 0.089–0.376, HR: 0.183, P<0.0001) were the indicators of prognosis (Table 4). The multivariate analysis, relying on the OS proportional hazard modeling, revealed that FOXP3 (95% CI: 1.812–5.763, HR: 3.232, P<0.0001), chemotherapy (95% CI: 0.088–0.381, HR: 0.183, P<0.0001), endocrine therapy (95% CI: 0.140–0.465, HR: 0.255, P<0.0001), pathological TNM Stage (95% CI: 3.374–15.827, HR: 7.308, P<0.0001), radiotherapy (95% CI: 0.152–0.562, HR: 0.293, P<0.0001), were the indicators of potential outcome (Table 5). High FOXP3 levels were associated with pathological TNM Stage, radiotherapy, endocrine therapy, chemotherapy.
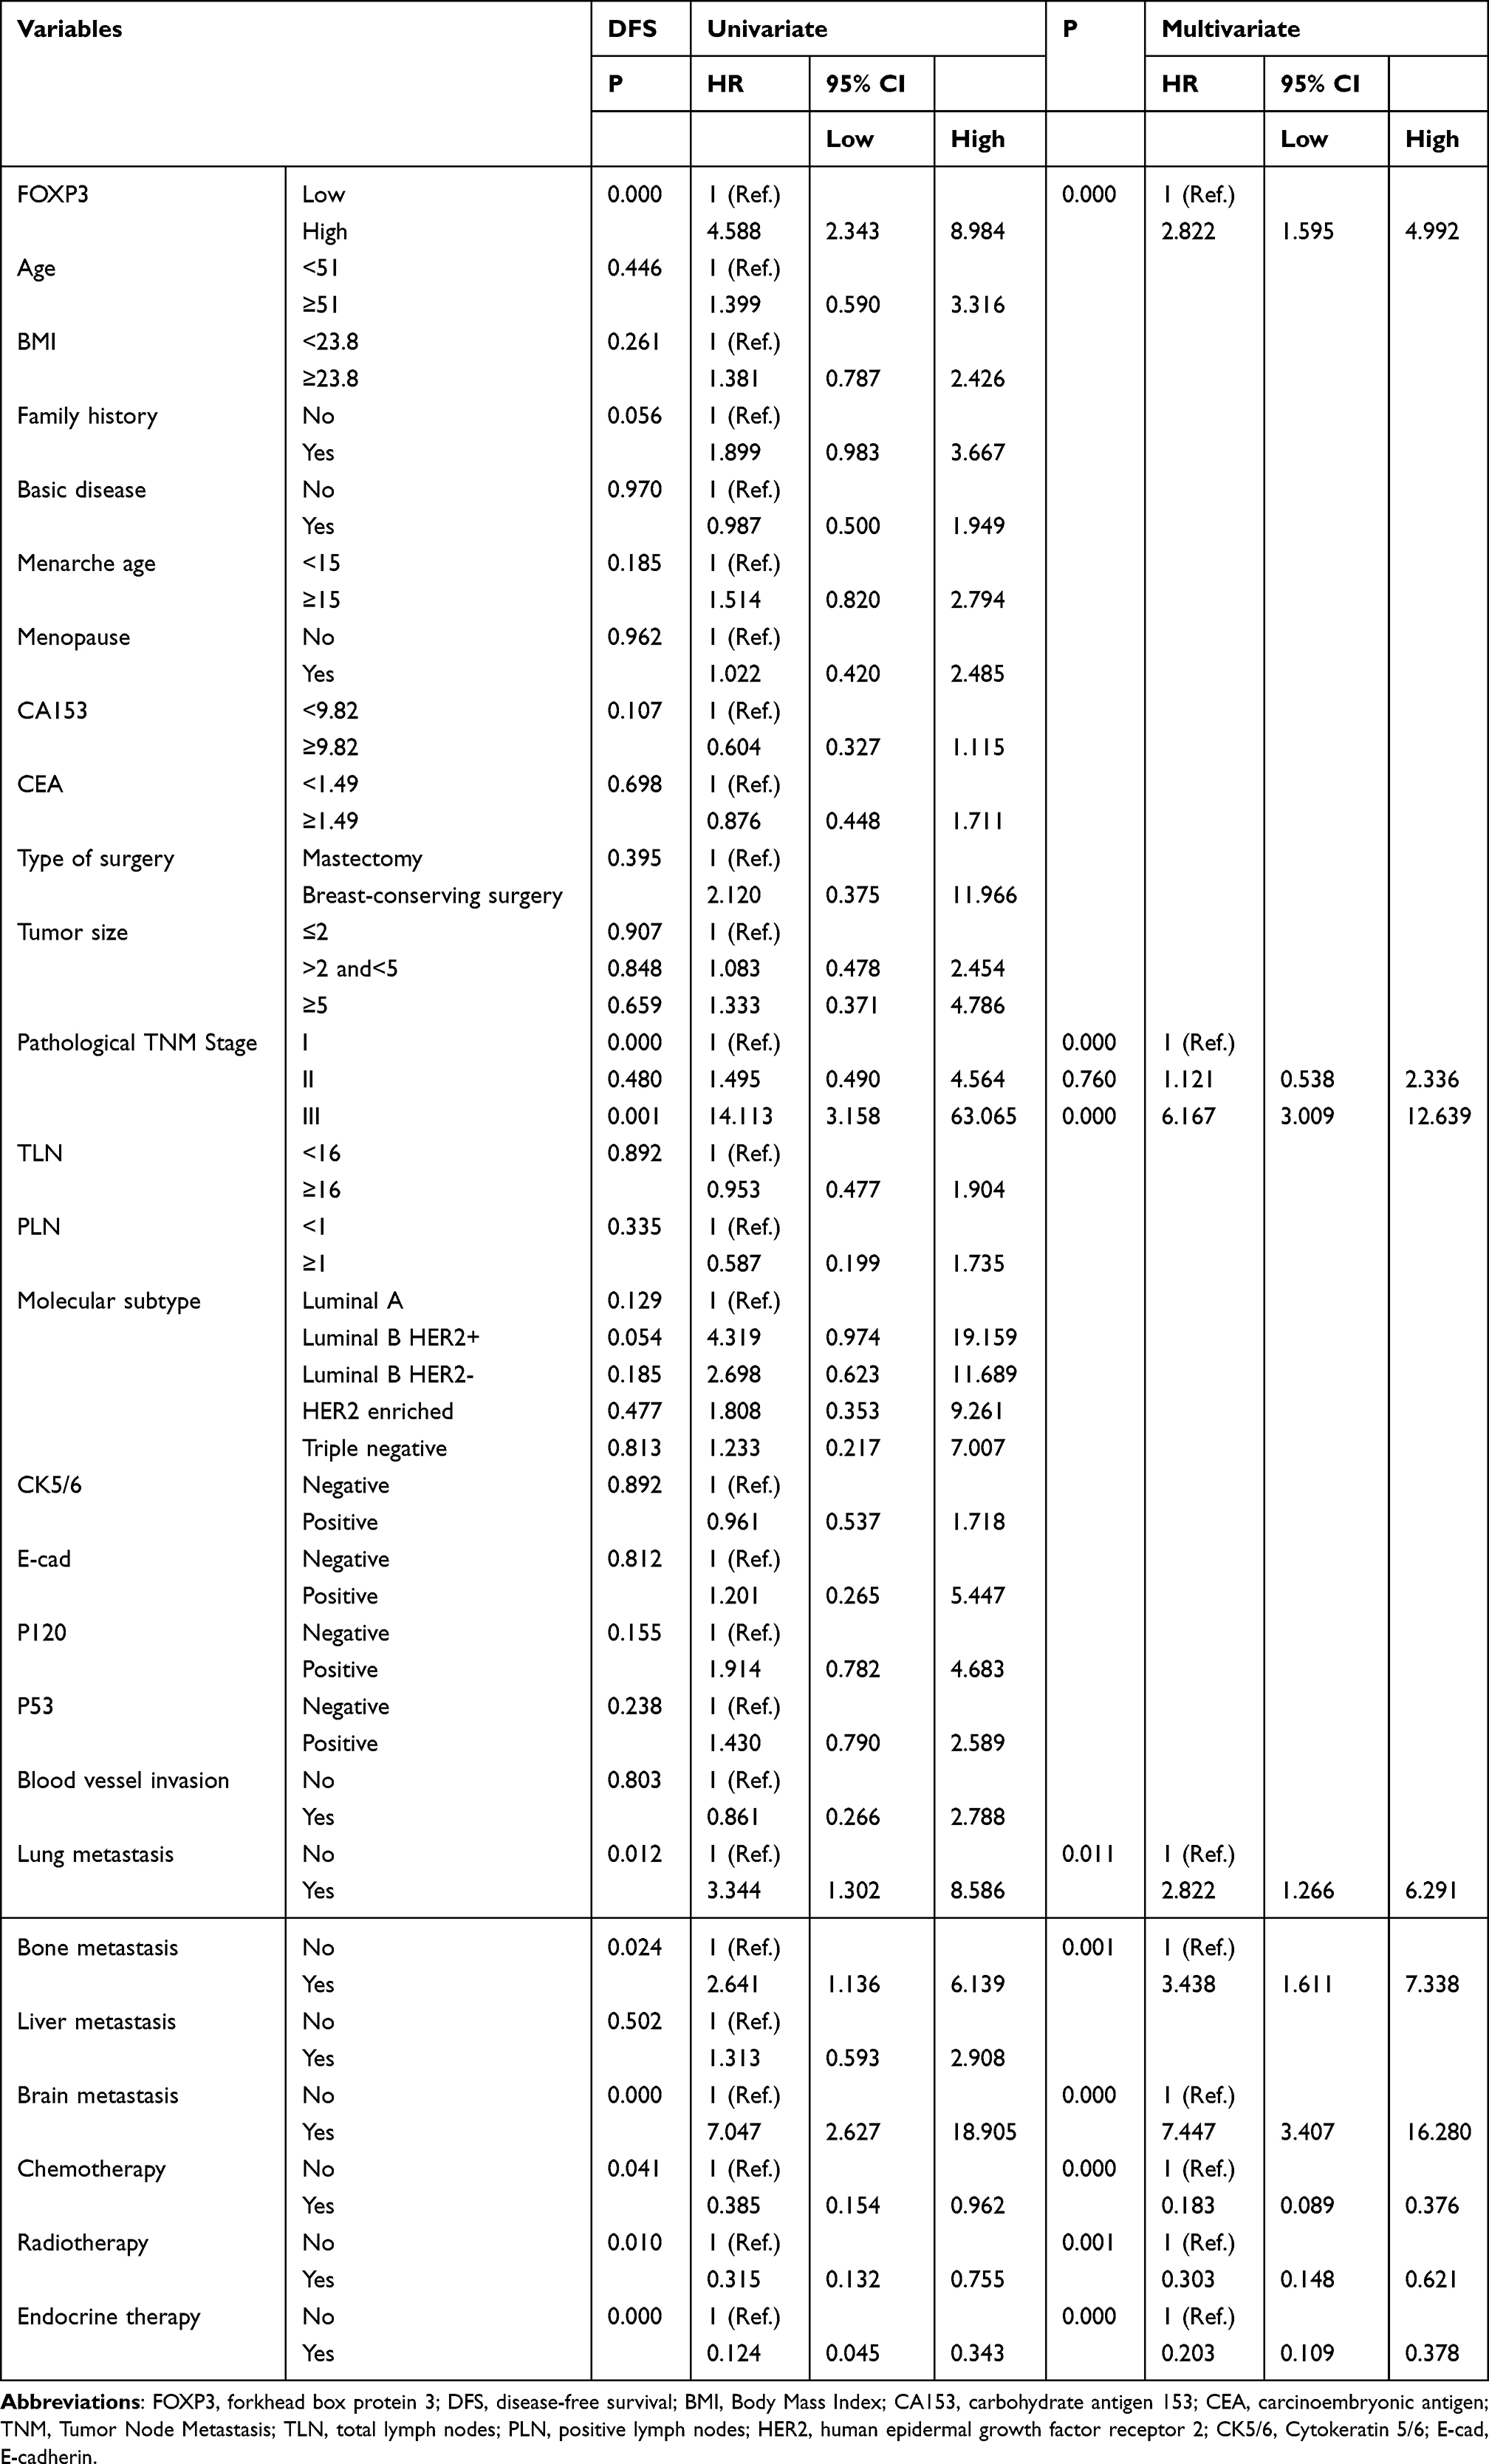 |
Table 4 Univariate and Multivariate COX Regression Models Analyses for the Prediction of DFS in Breast Cancer |
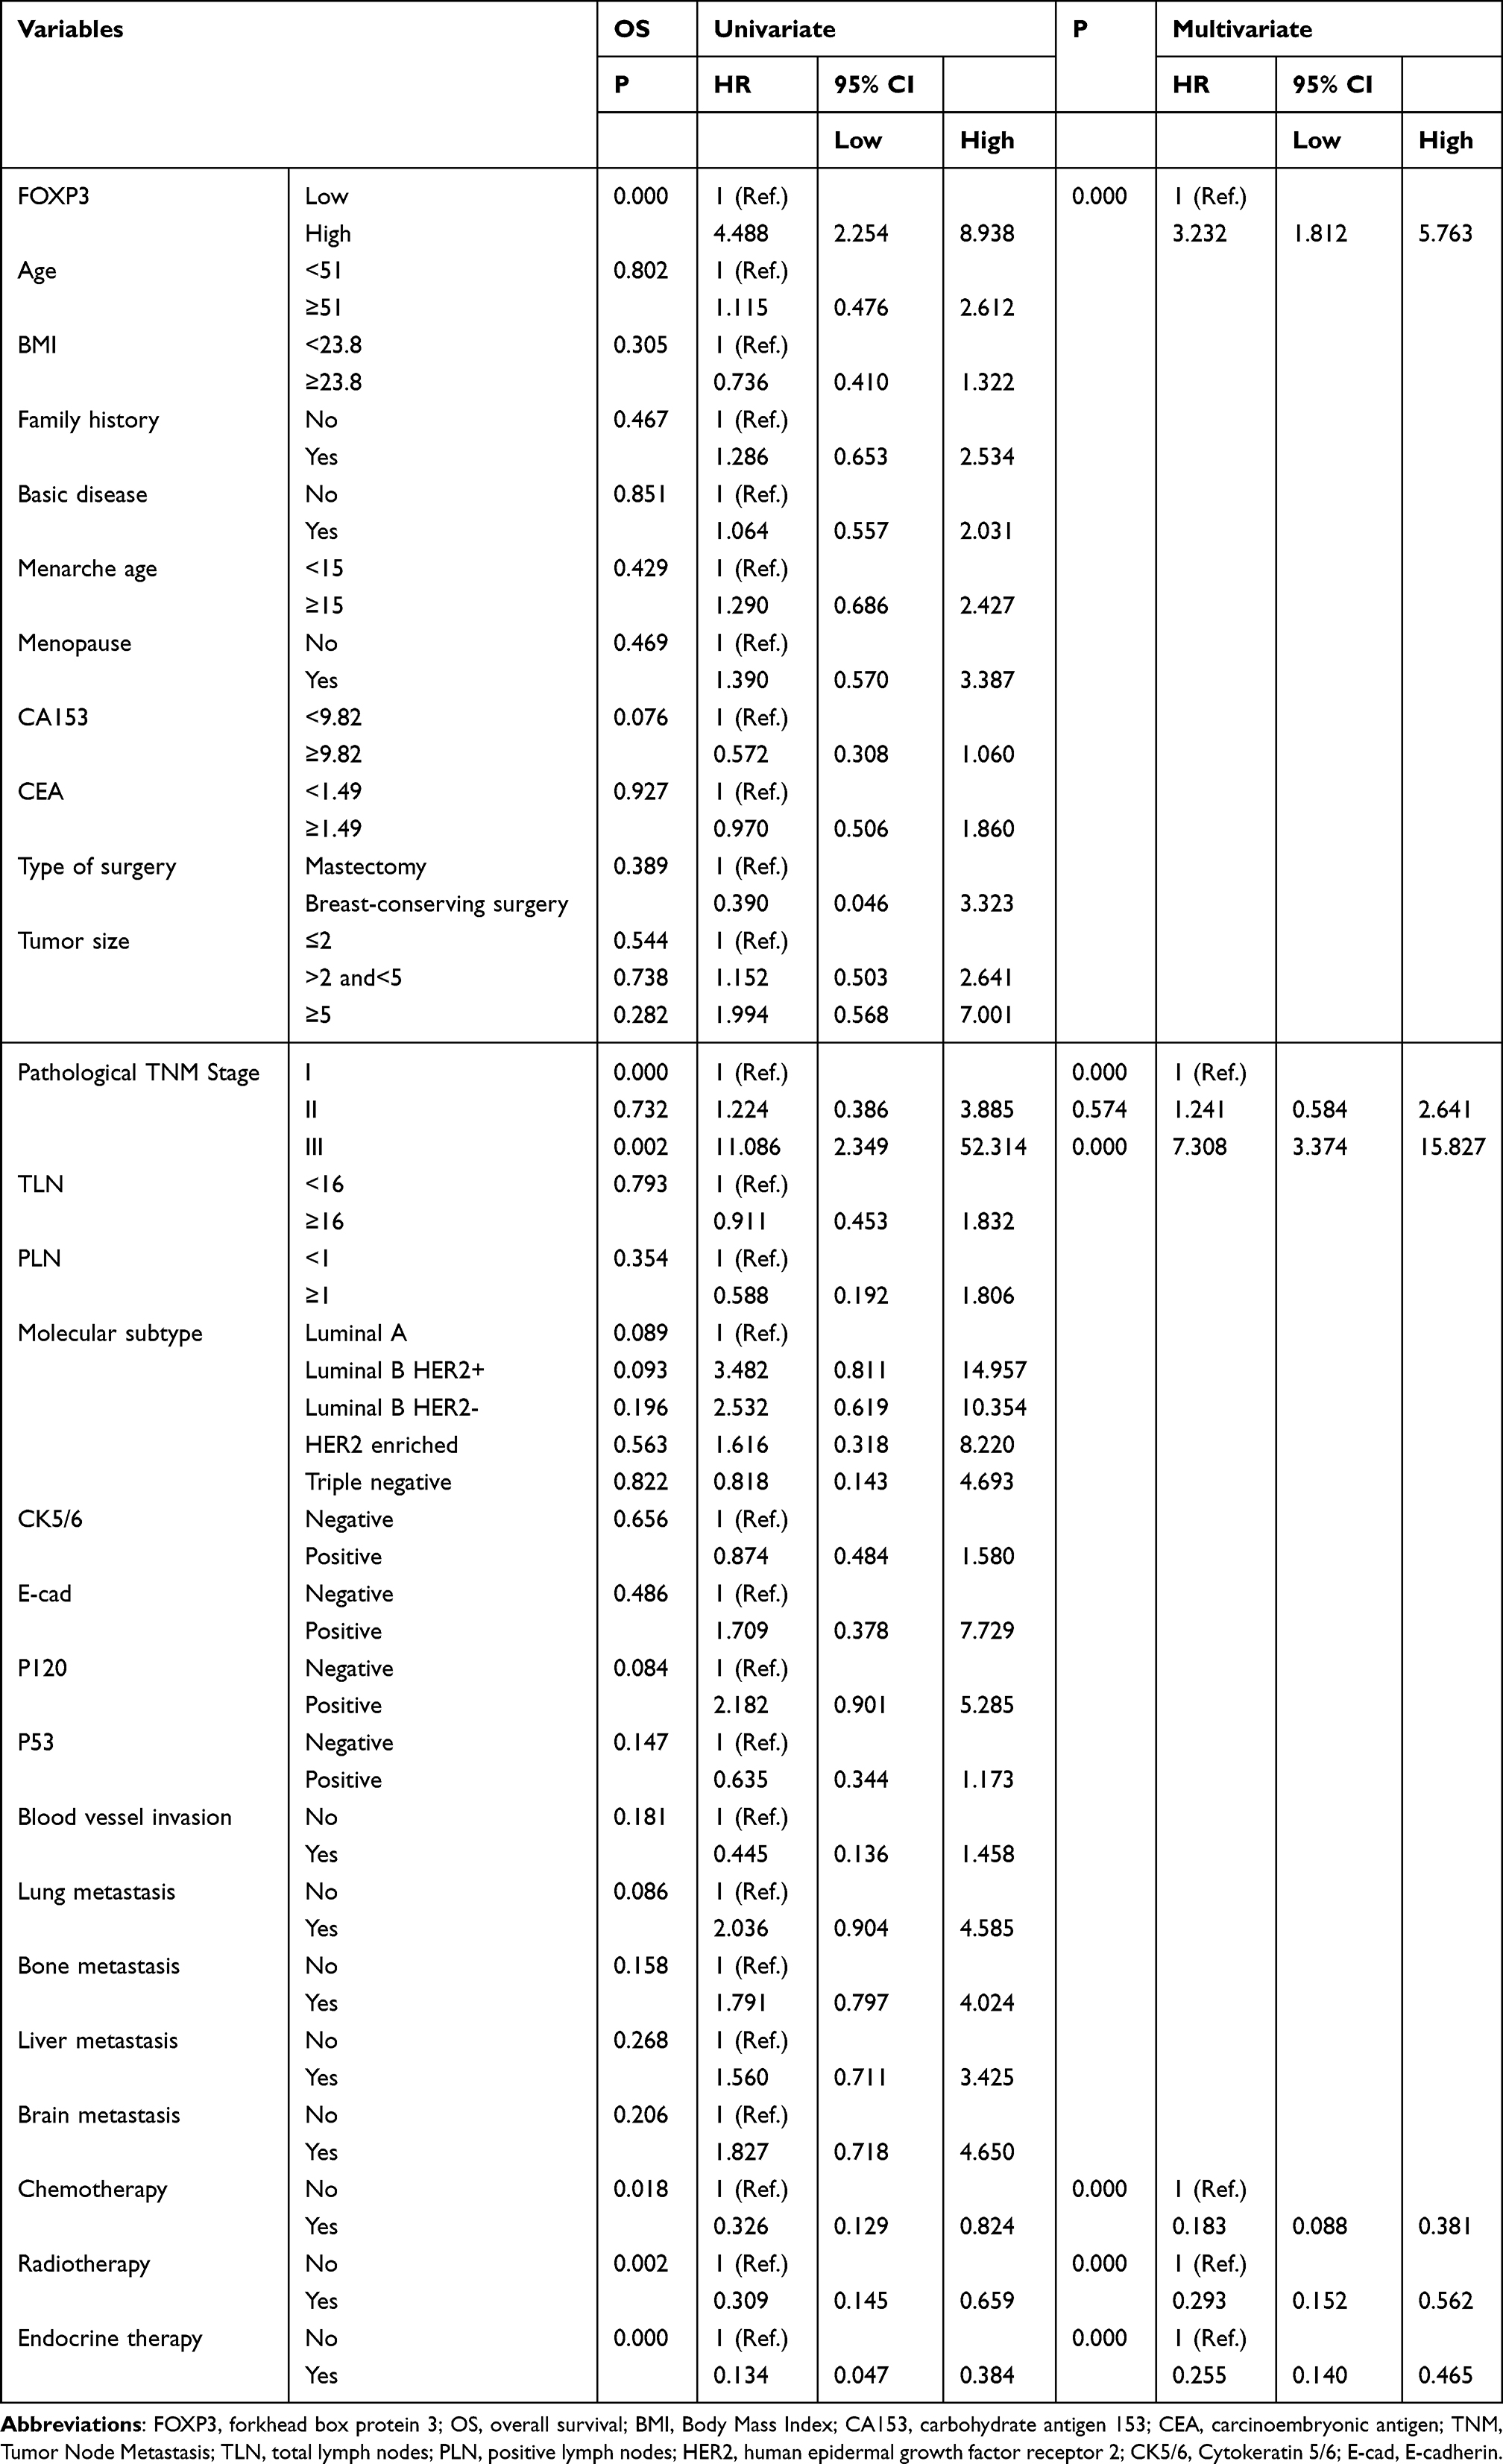 |
Table 5 Univariate and Multivariate COX Regression Models Analyses for the Prediction of OS in Breast Cancer |
Nomograms Created for Predicting Survival Outcomes
The prognostic nomogram for DFS prediction was formulated using various factors identified through multivariate analyses, which encompassed FOXP3, the pathological TNM stage, and the presence of lung, bone, and brain metastases, along with the administration of chemotherapy, radiotherapy, and endocrine therapy (Figure 2A). The establishment of an OS-predicting nomogram utilized the parameters derived from multivariate analyses, including FOXP3, pathological TNM Stage, as well as chemotherapy, radiotherapy, and endocrine therapy (Figure 2B). The calibration curves exhibited alignment between predicted and observed survival rates for 1-, 3-, and 5-year DFS (Figure 3A–C) and OS (Figure 3D–F). In addition, the decision curve analysis revealed that the nomogram models developed displayed superior predictive clinical utility compared to relying solely on FOXP3 for predicting the survival rates for 3-year and 5-year DFS (Figure 4A and B) and OS (Figure 4C and D). Moreover, the time-dependent receiver operating characteristic (TDROC) analysis demonstrated area under the receiver operating characteristic curve (AUROC) values of 0.715 (95% CI: 0.613–0.818) and 0.781 (95% CI: 0.753–0.808) for 1-year DFS and OS survival rates, respectively, during postoperative follow-up. For 3-year survival rates, the AUROC values following surgical follow-up were 0.703 (95% CI: 0.633–0.774) for DFS and 0.693 (95% CI: 0.610–0.777) for OS. Similarly, for 5-year survival rates, the AUROC values were 0.720 (95% CI: 0.657–0.784) for DFS and 0.718 (95% CI: 0.654–0.782) for OS during the postoperative follow-up period (Figure 5).
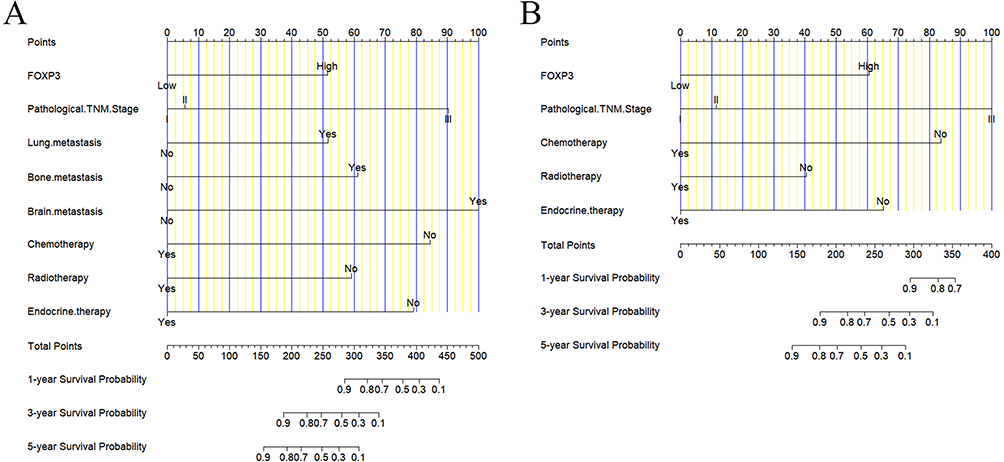 |
Figure 2 Disease-free survival (DFS) (A) and overall survival (OS) (B) nomograms predicted survival outcomes for breast cancer patients. |
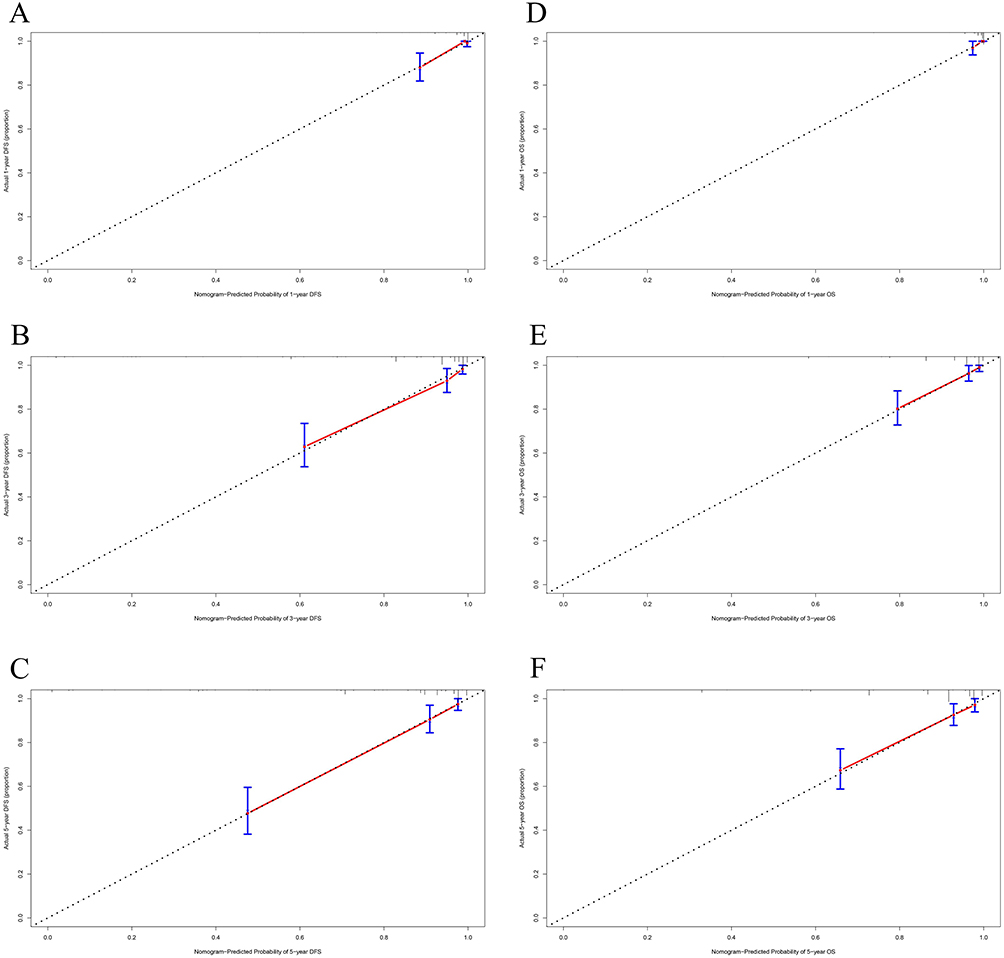 |
Figure 3 Calibration curves, serving to assess the predictive accuracy of nomograms, were utilized to evaluate survival time after surgery for breast cancer patients, focusing on both the 1-, 3-, and 5-year survival rates of disease-free survival (DFS) (A–C) and overall survival (OS) (D–F). |
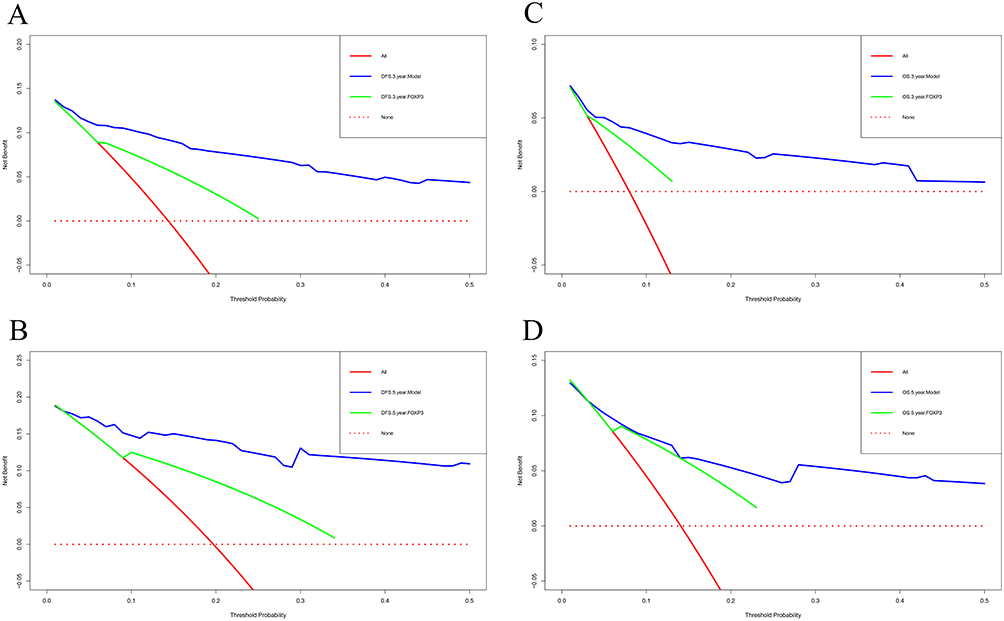 |
Figure 4 Decision curve analysis was conducted to assess the clinical usefulness of nomograms, particularly in predicting the 3-year and 5-year survival rates for both disease-free survival (DFS) (A and B) and overall survival (OS) (C and D) among breast cancer patients following surgical procedures. |
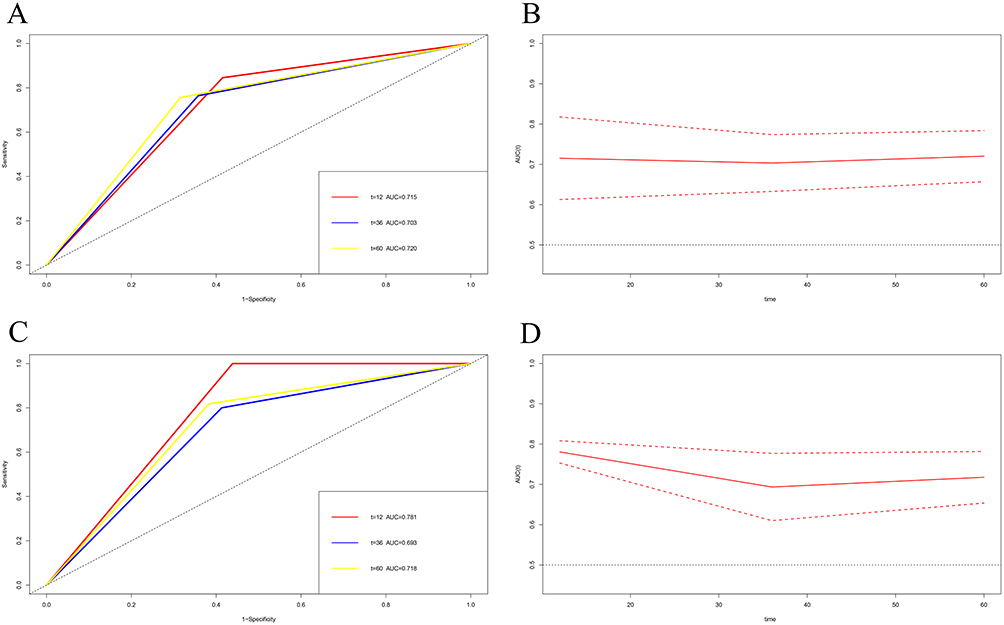 |
Figure 5 Time-dependent receiver operating characteristic (TDROC) analysis was utilized to examine the plots of analysis demonstrated area under the receiver operating characteristic curves (AUROCs) for FOXP3 expression in breast cancer patients postoperatively. (A and C) Dynamic AUROCs assessing DFS and OS over time. (B and D) Dynamic changes in the 95% CI surrounding the AUROCs for disease-free survival (DFS) and overall survival (OS). The dotted red line represents the 95% confidence interval (95CI) of AUROC values, whereas the solid red line depicts the AUROC value for various survival times. |
Discussion
TILs regard as a marker for the tumor immune microenvironment to reflect malignant tumors.18,19 TILs subsets encompass cells that eradicate cancer cells, including CD8+T lymphocytes, as well as cells that promote tumor proliferation such as Treg cells.20,21 Treg cells are instrumental in mediating the inactivation of CD8+ TILs and play a crucial role in triggering tumor cell death within the tumor microenvironment.22 Currently, FOXP3 stands as the most frequently utilized marker to identify Treg cells. A growing number of evidence indicated that Treg cells exerted a vital influence on the mechanisms of tumor immune evasion.23,24 FOXP3+ Treg cells, present in diverse cell populations exhibiting both regulatory and non-regulatory T cell functions, trigger the release of a range of cytokines, which played multiple-interaction in cancer progression.25 Studies have shown that the elevated infiltration of FOXP3+ lymphocytes within the tumor microenvironment was strongly linked to unfavorable prognosis among cancer patients.26,27 In Song JJ’s study, Foxp3 protein expression in tumor cells serves as a predictor for both 5-year relapse-free survival (RFS) and OS in patients diagnosed with oral squamous cell carcinoma (OSCC), and acts as a promising therapeutic target. Notably, those exhibiting overexpression of FOXP3 tend to have shorter OS and RFS durations.26 In an investigation centered around non-small cell lung cancer (NSCLC), the patients displaying elevated FOXP3+ infiltration demonstrated poorer survival rates, underscoring FOXP3’s substantial prognostic value in resected NSCLC cases.27 High expression of FOXP3+ in tumor cells is an independent predictor of tumor recurrence after hepatic resection for liver cancer (PMID: 17928188).28 Another study indicated that an increase in both tumor-infiltrating and circulating FOXP3(+) Tregs was observed in patients with early-stage hepatocellular carcinoma, which correlated significantly with poorer OS (P = 0.041 and 0.002, respectively) and a shortened RFS (P = 0.049 and 0.002, respectively).29
Even so, the clinicopathological and predictive significance of detecting FOXP3+ TILs remain inconclusive and debatable in patients with breast cancer. A meta-analysis revealed that the identification of FOXP3+ TILs in both core needle biopsies and excised specimens is feasible, thereby indicating a potential hazard indicator for lymph node metastasis in patients with breast cancer.30 West NR’s study shown that elevated levels of FOXP3(+) TILs were significantly linked to extended recurrence-free survival, and the status of FOXP3 remained unaffected by standard prognostic indicators in ER-negative breast cancer.31 Miyashita M’s study indicated that triple-negative breast cancers characterized by a high CD8+/FOXP3+ ratio exhibited greater sensitivity to anthracycline and taxane-based chemotherapy. Furthermore, the combined analysis of CD8+/FOXP3+ ratio and Ki-67 levels could effectively predict pathological complete response among triple-negative breast cancer patients receiving neoadjuvant chemotherapy.32 Takada K’s study demonstrated that in patients with HER2-positive breast cancer undergoing trastuzumab, pertuzumab, and docetaxel, those with a high CD8/FOXP3 ratio, high CD8+ levels, and PD-L1 negativity exhibited significantly longer progression-free survival compared to patients with a low CD8/FOXP3 ratio, low CD8+ levels, and PD-L1 positivity.33 Despite that, the predictive abilities, and roles of FOXP3 expression in breast cancer tissues remain incompletely explored. Hence, our findings suggested FOXP3 as a promising prognostic marker for breast cancer, offering fresh insights into its association with treatment outcomes in patients.
Interestingly, the FOXP3 expression in tumor cells also related to the hematological indices, such as lactate dehydrogenase, blood urea nitrogen, prealbumin. In Karube K’s study, FOXP3 did not differ significantly in lactate dehydrogenase in serum and overall survival.34 One study also indicated that lactic acid plays an important role in regulating Treg cell differentiation and affects FOXP3 protein and gene expression.35 For sepsis-associated acute kidney injury (SA-AKI), combined with MSCs plus Gal-9 could decrease the levels of blood urea nitrogen, then induced FOXP3 expression.36 The number of FOXP3+TILs was associated to the preoperative serum albumin levels, and also was an independent prognostic marker for the survival of CRC patients.37
This study assessed FOXP3 expression levels in tumor tissues from 313 breast cancer patients using IHC. Then, we analyzed the relationships among FOXP3 expression and the clinical pathological parameters, and the data revealed a connection between the expression of FOXP3 and molecular subtype (P=0.004). Qian F’s study indicated that the abundance of FOXP3+ T cells infiltrating tumor tissue was indicative of a less favorable prognosis in ER-positive breast cancer.38 Jääskeläinen MM’s study shown that an increased quantity of FOXP3+ TILs correlated with shorter durations of DFS (P=0.040, 54% vs 79%) in Luminal B HER2+ breast cancer.39 Besides, of these patients, association analysis verified that the presence of FOXP3 expression correlated with the occurrence of metastasis, such as lung metastasis and liver metastasis. In Stenström J’ study, regulatory T lymphocytes (Tregs, FOXP3+) infiltration independently influenced the prognosis of survival in metastatic breast cancer patients (95% CI = 1.14–2.59, HR = 1.72, P = 0.01).40 Moreover, the Treg infiltration deciphered patients with metastatic breast cancer facing poorer prognosis may benefit from targeting Tregs and FOXP3+ infiltration as an immunogenic therapy.40
At the same comment, we found that the low FOXP3 expression in tumor cells was predictive of longer DFS and OS among breast cancer patients. Importantly, multivariate Cox analysis revealed FOXP3 as a potential standalone indicator for both DFS and OS. In breast cancer patients, we further explored the correlation between FOXP3 expression and adjuvant therapy following surgery. Our results revealed that patients displaying lower FOXP3 expression tended to survive longer than those with higher expression, particularly among those undergoing chemotherapy or radiotherapy. In Ladoire S’s study, in the Phase III UNICANCER-PACS 01 trial, the expression of FOXP3 in tumor cells could serve as a precise biomarker to predict the effectiveness of anthracyclines among patients diagnosed with primary breast cancer receiving adjuvant chemotherapy.41 Other study demonstrated that after neoadjuvant chemotherapy, patients with TNBC displaying a favorable CD8/FOXP3 ratio and high CD8(+) TIL counts in residual tumors can precisely forecast a better prognosis, despite a non-pathological complete response.42 It is generally believed that the TNM stage is the remarkable indicator to forecast the prognosis of malignant tumors. Within this investigation, we dug deeper to understand the association between FOXP3 expression levels and TNM staging following breast cancer surgery. Our findings revealed that patients exhibiting low FOXP3 expression levels in tumor cells leaned towards a longer survival duration contrasted with those with high expression, particularly among those diagnosed with stage III disease.
The previously discovered potential mechanisms may provide an explanation for the observed role of FOXP3 in breast cancer. FOXP3, as Treg cells, is contemplated to play a key function in safeguarding against autoimmune diseases, maintaining immune tolerance, and suppressing antitumor immune responses.43 FOXP3 suppresses breast cancer development by blocking the transcriptional activation of oncogenic factors like SKP2 and HER2.44 Moreover, FOXP3 can interact with TCF4 and β-catenin to strengthen their function and provoke the transcription of Wnt-regulated genes to enhance cellular proliferation, invasion, and EMT initiation.45 FOXP3+ Treg promotes immune escape of tumor cells by inhibiting effector T lymphocytes.46
This study has some limitations. Firstly, this study is a retrospective analysis with one single institution only. Secondly, we mainly detect the expression of FOXP3 in breast cancer tissues. The tumor infiltrating Tregs by Treg marker of CD4 need studied in the further study. Thirdly, follow-up time of the current study is limited, and extending the follow-up and observation time may lead to different findings. Lastly, the nomograms established need to be tested and verified by external validation cohort in the further study.
Conclusion
In summary, our study revealed the presence of FOXP3 expression in 313 breast cancer patients, validating its standalone predictive capability for survival and disease outcome. The nomograms incorporating FOXP3 can simplify decision-making processes. Although further investigations are needed before suggesting a change in clinical practice, the current results suggest that the evaluation of FOXP3 combined with other risk factors can improve cancer prognostic stratification. To elucidate the fundamental mechanism of how FOXP3 impacts tumor cell functionality within the breast cancer microenvironment, additional research is imperative. We anticipate that the FOXP3 expression levels could emerge as a promising biomarker, guiding therapeutic alternatives for breast cancer patients.
Abbreviations
FOXP3, forkhead box protein 3; IHC, Immunohistochemistry; DFS, disease-free survival; OS, overall survival; ER, estrogen receptor; PR, progesterone receptor; HER2, human epidermal growth factor receptor 2; TILs, tumor-infiltrating lymphocytes; FFPE, formalin-fixed paraffin-embedded; BSA, bovine serum albumin; AJCC, American Joint Committee on Cancer; UICC, the Union for International Cancer Control; LDH, lactate dehydrogenase; BUN, blood urea nitrogen; PAB, prealbumin; CEA, carcinoembryonic antigen; INR, international normalized ratio; PT, prothrombin time; GGT, gamma glutamyl transferase; DBIL, direct bilirubin; ALP, alkaline phosphatase; TDROC, time-dependent receiver operating characteristic; AUROC, analysis demonstrated area under the receiver operating characteristic curve; RFS, relapse-free survival; OSCC, oral squamous cell carcinoma; NSCLC, non-small cell lung cancer; Tregs, regulatory T lymphocytes; BMI, Body Mass Index; TLN, total lymph nodes; PLN, positive lymph nodes; CK5/6, Cytokeratin 5/6; E-cad, E-cadherin; ALT, alanine aminotransferase; AST, aspartate transaminase; GLU, glucose; ALB, albumin; CRE, Creatinine; URIC, Uric acid; TBIL, total bilirubin; IBIL, indirect Bilirubin; TP, total protein; G, globulin; A/G, albumin/globulin; CA153, carbohydrate antigen 153; D-D, D-Dimer; FBG, Fibrinogen; APTT, activated partial thromboplastin time; TT, thrombin time; BMI, Body Mass Index; TNM, Tumor Node Metastasis.
Data Sharing Statement
The authors confirm that the data supporting the findings of this study are available within the article and its supplementary materials.
Ethics Approval and Informed Consent
This research received approval from the Ethics Committee of Harbin Medical University Cancer Hospital (Grant Number: KY2023-38). In this study, all participants were thoroughly informed about the objectives, procedures, potential risks, and their rights related to the research. Specifically, written informed consent was obtained from each participant, documenting their agreement to participate in the research and authorizing the use of their data for scientific analysis. This retrospective single center study was conducted in accordance with the Declaration of Helsinki.
Acknowledgments
The authors thank the patients for their contributions to the investigation of clinical data and sample collection.
Author Contributions
All authors made a significant contribution to the work reported, whether that is in the conception, study design, execution, acquisition of data, analysis and interpretation, or in all these areas; took part in drafting, revising or critically reviewing the article; gave final approval of the version to be published; have agreed on the journal to which the article has been submitted; and agree to be accountable for all aspects of the work.
Funding
This research was supported by grants from the Practice and Innovation Project for Postgraduates of Harbin Medical University (Grant Number: YJSCX2023-79HYD).
Disclosure
The authors report no conflicts of interest in this work.
References
1. Siegel RL, Miller KD, Fuchs HE, Jemal A. Cancer statistics, 2021. CA Cancer J Clin. 2021;71(1):7–33. doi:10.3322/caac.21654
2. Sung H, Ferlay J, Siegel RL, et al. Global cancer statistics 2020: GLOBOCAN estimates of incidence and mortality worldwide for 36 cancers in 185 countries. CA Cancer J Clin. 2021;71(3):209–249. doi:10.3322/caac.21660
3. Han B, Zheng R, Zeng H, et al. Cancer incidence and mortality in China, 2022. J Natl Cancer Cent. 2024:S2667005424000061. Published online February. doi:10.1016/j.jncc.2024.01.006
4. Denkert C, Von Minckwitz G, Darb-Esfahani S, et al. Tumour-infiltrating lymphocytes and prognosis in different subtypes of breast cancer: a pooled analysis of 3771 patients treated with neoadjuvant therapy. Lancet Oncol. 2018;19(1):40–50. doi:10.1016/S1470-2045(17)30904-X
5. Cilibrasi C, Papanastasopoulos P, Samuels M, Giamas G. Reconstituting immune surveillance in breast cancer: molecular pathophysiology and current immunotherapy strategies. IJMS. 2021;22(21):12015. doi:10.3390/ijms222112015
6. Virassamy B, Caramia F, Savas P, et al. Intratumoral CD8+ T cells with a tissue-resident memory phenotype mediate local immunity and immune checkpoint responses in breast cancer. Cancer Cell. 2023;41(3):585–601.e8. doi:10.1016/j.ccell.2023.01.004
7. Rohan TE, Arthur R, Wang Y, et al. Infiltrating immune cells in benign breast disease and risk of subsequent invasive breast cancer. Breast Cancer Res. 2021;23(1):15. doi:10.1186/s13058-021-01395-x
8. Lin B, Du L, Li H, Zhu X, Cui L, Li X. Tumor-infiltrating lymphocytes: warriors fight against tumors powerfully. Biomed Pharmacother. 2020;132:110873. doi:10.1016/j.biopha.2020.110873
9. Stanton SE, Disis ML. Clinical significance of tumor-infiltrating lymphocytes in breast cancer. J Immunother Cancer. 2016;4:59. doi:10.1186/s40425-016-0165-6
10. Shafabakhsh R, Pourhanifeh MH, Mirzaei HR, Sahebkar A, Asemi Z, Mirzaei H. Targeting regulatory T cells by curcumin: a potential for cancer immunotherapy. Pharmacol Res. 2019;147:104353. doi:10.1016/j.phrs.2019.104353
11. Bahrami A, Fereidouni M, Pirro M, Bianconi V, Sahebkar A. Modulation of regulatory T cells by natural products in cancer. Cancer Lett. 2019;459:72–85. doi:10.1016/j.canlet.2019.06.001
12. Whiteside TL. FOXP3+ Treg as a therapeutic target for promoting anti-tumor immunity. Expert Opin Ther Targets. 2018;22(4):353–363. doi:10.1080/14728222.2018.1451514
13. Scheinecker C, Göschl L, Bonelli M. Treg cells in health and autoimmune diseases: new insights from single cell analysis. J Autoimmun. 2020;110:102376. doi:10.1016/j.jaut.2019.102376
14. Tanaka A, Sakaguchi S. Regulatory T cells in cancer immunotherapy. Cell Res. 2017;27(1):109–118. doi:10.1038/cr.2016.151
15. Ling A, Lundberg IV, Eklöf V, et al. The infiltration, and prognostic importance, of Th1 lymphocytes vary in molecular subgroups of colorectal cancer. J Pathol Clin Res. 2016;2(1):21–31. doi:10.1002/cjp2.31
16. Tian J, Cheng C, Gao J, et al. POLD1 as a prognostic biomarker correlated with cell proliferation and immune infiltration in clear cell renal cell carcinoma. Int J Mol Sci. 2023;24(7):6849. doi:10.3390/ijms24076849
17. Wang W, Hodkinson P, McLaren F, et al. Small cell lung cancer tumour cells induce regulatory T lymphocytes, and patient survival correlates negatively with FOXP3+ cells in tumour infiltrate. Int J Cancer. 2012;131(6):E928–937. doi:10.1002/ijc.27613
18. Tas L, Jedema I, Haanen JBAG. Novel strategies to improve efficacy of treatment with tumor-infiltrating lymphocytes (TILs) for patients with solid cancers. Curr Opin Oncol. 2023;35(2):107–113. doi:10.1097/CCO.0000000000000925
19. Vaid PM, Puntambekar AK, Jumle NS, et al. Evaluation of tumor-infiltrating lymphocytes (TILs) in molecular subtypes of an Indian cohort of breast cancer patients. Diagn Pathol. 2022;17(1):91. doi:10.1186/s13000-022-01271-y
20. Astuti A, Miskad UA, Arsyadi G, Zainuddin AA, Wahid S, Nelwan BJ. CD8+ TILS expression in invasive breast carcinoma (no special type). Asian Pac J Cancer Prev. 2022;23(5):1813–1816. doi:10.31557/APJCP.2022.23.5.1813
21. Watson MJ, Vignali PDA, Mullett SJ, et al. Metabolic support of tumour-infiltrating regulatory T cells by lactic acid. Nature. 2021;591:(7851):645–651. doi:10.1038/s41586-020-03045-2
22. Mizutani N, Kangsanant S, Sagara A, Miyazaki M, Nabe T. CD8+ T cells regulated by CD4+CD25+ regulatory T cells in the early stage exacerbate the development of Dermatophagoides farinae-induced skin lesions via increasing mast cell infiltration in mice. Eur J Pharmacol. 2020;868:172843. doi:10.1016/j.ejphar.2019.172843
23. Paijens ST, Vledder A, De Bruyn M, Nijman HW. Tumor-infiltrating lymphocytes in the immunotherapy era. Cell Mol Immunol. 2021;18(4):842–859. doi:10.1038/s41423-020-00565-9
24. Levings MK, Sangregorio R, Roncarolo MG. Human Cd25+Cd4+ T regulatory cells suppress naive and memory T cell proliferation and can be expanded in vitro without loss of function. J Exp Med. 2001;193(11):1295–1302. doi:10.1084/jem.193.11.1295
25. Ozga AJ, Chow MT, Luster AD. Chemokines and the immune response to cancer. Immunity. 2021;54(5):859–874. doi:10.1016/j.immuni.2021.01.012
26. Song JJ, Zhao SJ, Fang J, et al. Foxp3 overexpression in tumor cells predicts poor survival in oral squamous cell carcinoma. BMC Cancer. 2016;16:530. doi:10.1186/s12885-016-2419-6
27. O’Callaghan DS, Rexhepaj E, Gately K, et al. Tumour islet Foxp3+ T-cell infiltration predicts poor outcome in nonsmall cell lung cancer. Eur Respir J. 2015;46(6):1762–1772. doi:10.1183/13993003.00176-2014
28. Sasaki A, Tanaka F, Mimori K, et al. Prognostic value of tumor-infiltrating FOXP3+ regulatory T cells in patients with hepatocellular carcinoma. Eur J Surg Oncol. 2008;34(2):173–179. doi:10.1016/j.ejso.2007.08.008
29. Wang F, Jing X, Li G, et al. Foxp3+ regulatory T cells are associated with the natural history of chronic hepatitis B and poor prognosis of hepatocellular carcinoma. Liver Int. 2012;32(4):644–655. doi:10.1111/j.1478-3231.2011.02675.x
30. Jiang D, Gao Z, Cai Z, Wang M, He J. Clinicopathological and prognostic significance of FOXP3+ tumor infiltrating lymphocytes in patients with breast cancer: a meta-analysis. BMC Cancer. 2015;15(1):727. doi:10.1186/s12885-015-1742-7
31. West NR, Kost SE, Martin SD, et al. Tumour-infiltrating FOXP3+ lymphocytes are associated with cytotoxic immune responses and good clinical outcome in oestrogen receptor-negative breast cancer. Br J Cancer. 2013;108(1):155–162. doi:10.1038/bjc.2012.524
32. Miyashita M, Sasano H, Tamaki K, et al. Tumor-infiltrating CD8+ and FOXP3+ lymphocytes in triple-negative breast cancer: its correlation with pathological complete response to neoadjuvant chemotherapy. Breast Cancer Res Treat. 2014;148(3):525–534. doi:10.1007/s10549-014-3197-y
33. Takada K, Kashiwagi S, Goto W, et al. Use of the tumor-infiltrating CD8 to FOXP3 lymphocyte ratio in predicting treatment responses to combination therapy with pertuzumab, trastuzumab, and docetaxel for advanced HER2-positive breast cancer. J Transl Med. 2018;16(1):86. doi:10.1186/s12967-018-1460-4
34. Karube K, Aoki R, Sugita Y, et al. The relationship of FOXP3 expression and clinicopathological characteristics in adult T-cell leukemia/lymphoma. Mod Pathol. 2008;21(5):617–625. doi:10.1038/modpathol.2008.25
35. Zhang YT, Xing ML, Fang HH, Li WD, Wu L, Chen ZP. Effects of lactate on metabolism and differentiation of CD4+T cells. Mol Immunol. 2023;154:96–107. doi:10.1016/j.molimm.2022.12.015
36. Luo C, Luo F, Che L, et al. Mesenchymal stem cells protect against sepsis-associated acute kidney injury by inducing Gal-9/Tim-3 to remodel immune homeostasis. Ren Fail. 2023;45(1):2187229. doi:10.1080/0886022X.2023.2187229
37. Liu Y, Xia T, Jin C, et al. FOXP3 and CEACAM6 expression and T cell infiltration in the occurrence and development of colon cancer. Oncol Lett. 2016;11(6):3693–3701. doi:10.3892/ol.2016.4439
38. Qian F, Qingping Y, Linquan W, et al. High tumor-infiltrating FoxP3+ T cells predict poor survival in estrogen receptor-positive breast cancer: a meta-analysis. Eur J Surg Oncol. 2017;43(7):1258–1264. doi:10.1016/j.ejso.2017.01.011
39. Jääskeläinen MM, Tiainen S, Siiskonen H, et al. The prognostic and predictive role of tumor-infiltrating lymphocytes (FoxP3 + and CD8 +) and tumor-associated macrophages in early HER2 + breast cancer. Breast Cancer Res Treat. 2023;201(2):183–192. doi:10.1007/s10549-023-07017-8
40. Stenström J, Hedenfalk I, Hagerling C. Regulatory T lymphocyte infiltration in metastatic breast cancer-an independent prognostic factor that changes with tumor progression. Breast Cancer Res. 2021;23(1):27. doi:10.1186/s13058-021-01403-0
41. Ladoire S, Mignot G, Dalban C, et al. FOXP3 expression in cancer cells and anthracyclines efficacy in patients with primary breast cancer treated with adjuvant chemotherapy in the phase III UNICANCER-PACS 01 trial. Ann Oncol. 2012;23(10):2552–2561. doi:10.1093/annonc/mds028
42. Miyashita M, Sasano H, Tamaki K, et al. Prognostic significance of tumor-infiltrating CD8+ and FOXP3+ lymphocytes in residual tumors and alterations in these parameters after neoadjuvant chemotherapy in triple-negative breast cancer: a retrospective multicenter study. Breast Cancer Res. 2015;17(1):124. doi:10.1186/s13058-015-0632-x
43. Bilate AM, Lafaille JJ. Induced CD4+Foxp3+ regulatory T cells in immune tolerance. Annu Rev Immunol. 2012;30:733–758. doi:10.1146/annurev-immunol-020711-075043
44. Zuo T, Liu R, Zhang H, et al. FOXP3 is a novel transcriptional repressor for the breast cancer oncogene SKP2. J Clin Invest. 2007;117(12):3765–3773. doi:10.1172/JCI32538
45. Yang S, Liu Y, Li MY, et al. FOXP3 promotes tumor growth and metastasis by activating Wnt/β-catenin signaling pathway and EMT in non-small cell lung cancer. Mol Cancer. 2017;16(1):124. doi:10.1186/s12943-017-0700-1
46. Lee DY, Im E, Yoon D, et al. Pivotal role of PD-1/PD-L1 immune checkpoints in immune escape and cancer progression: their interplay with platelets and FOXP3+Tregs related molecules, clinical implications and combinational potential with phytochemicals. Semin Cancer Biol. 2022;86(Pt 3):1033–1057. doi:10.1016/j.semcancer.2020.12.001
 © 2024 The Author(s). This work is published and licensed by Dove Medical Press Limited. The
full terms of this license are available at https://www.dovepress.com/terms
and incorporate the Creative Commons Attribution
- Non Commercial (unported, 3.0) License.
By accessing the work you hereby accept the Terms. Non-commercial uses of the work are permitted
without any further permission from Dove Medical Press Limited, provided the work is properly
attributed. For permission for commercial use of this work, please see paragraphs 4.2 and 5 of our Terms.
© 2024 The Author(s). This work is published and licensed by Dove Medical Press Limited. The
full terms of this license are available at https://www.dovepress.com/terms
and incorporate the Creative Commons Attribution
- Non Commercial (unported, 3.0) License.
By accessing the work you hereby accept the Terms. Non-commercial uses of the work are permitted
without any further permission from Dove Medical Press Limited, provided the work is properly
attributed. For permission for commercial use of this work, please see paragraphs 4.2 and 5 of our Terms.